Getting Started
Choose how you want to work with Vega.
Web App
No code requiredSign up and use the dashboard to track satellites, run interference forecasts, and visualize results — all from the browser.
Operators, analysts, and teams who want immediate insights without writing code.
-
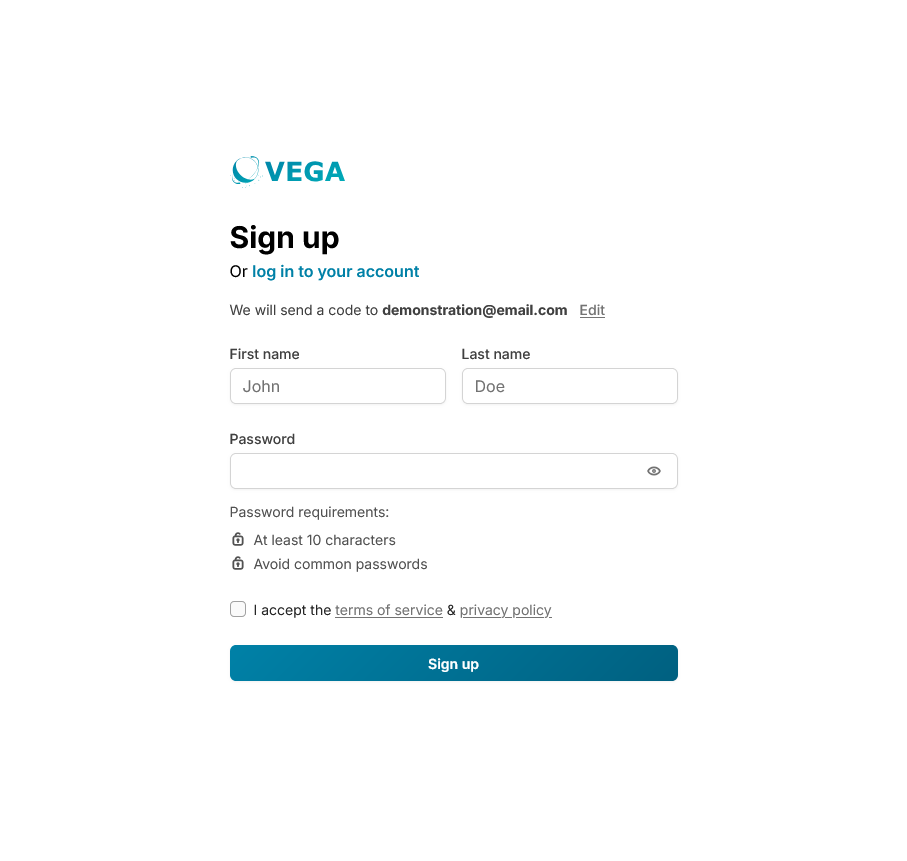
1 Create a free team account tied to your organization with your work email
-
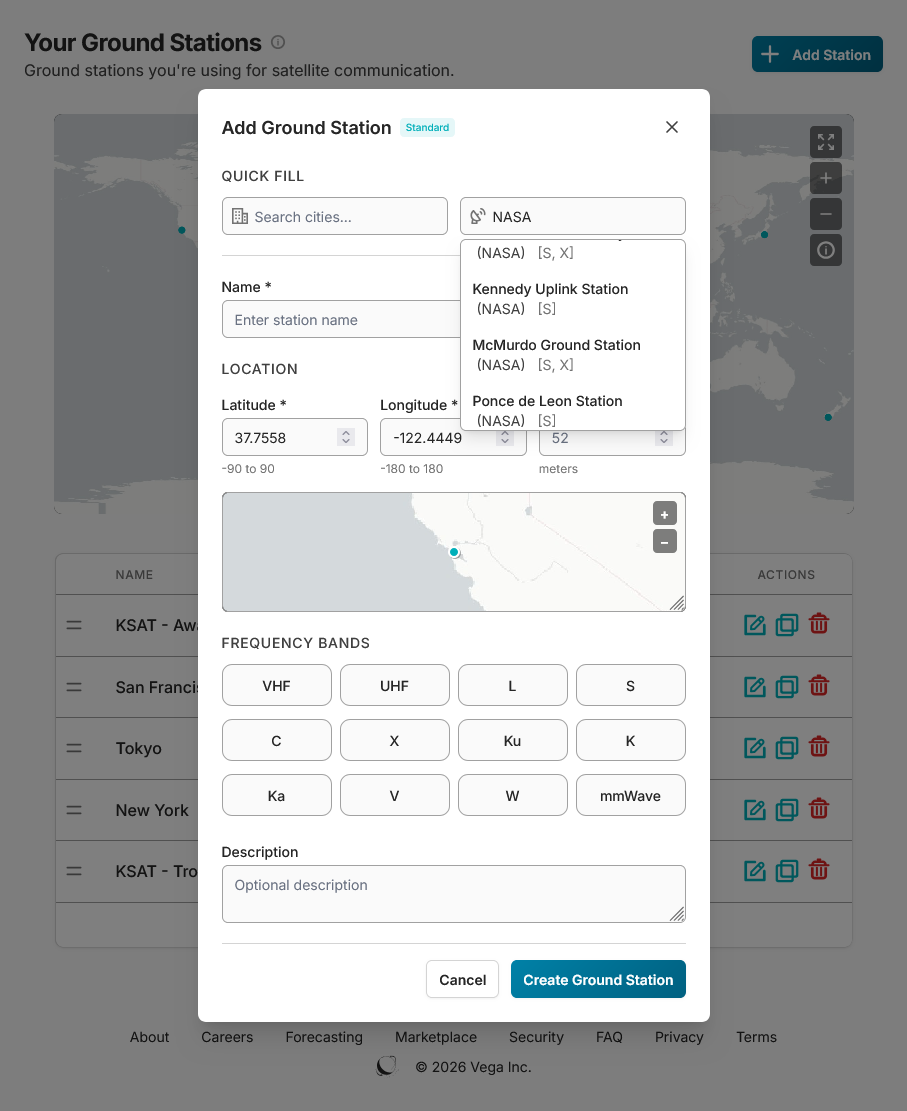
2 Add your ground stations either manually or from our existing set
-
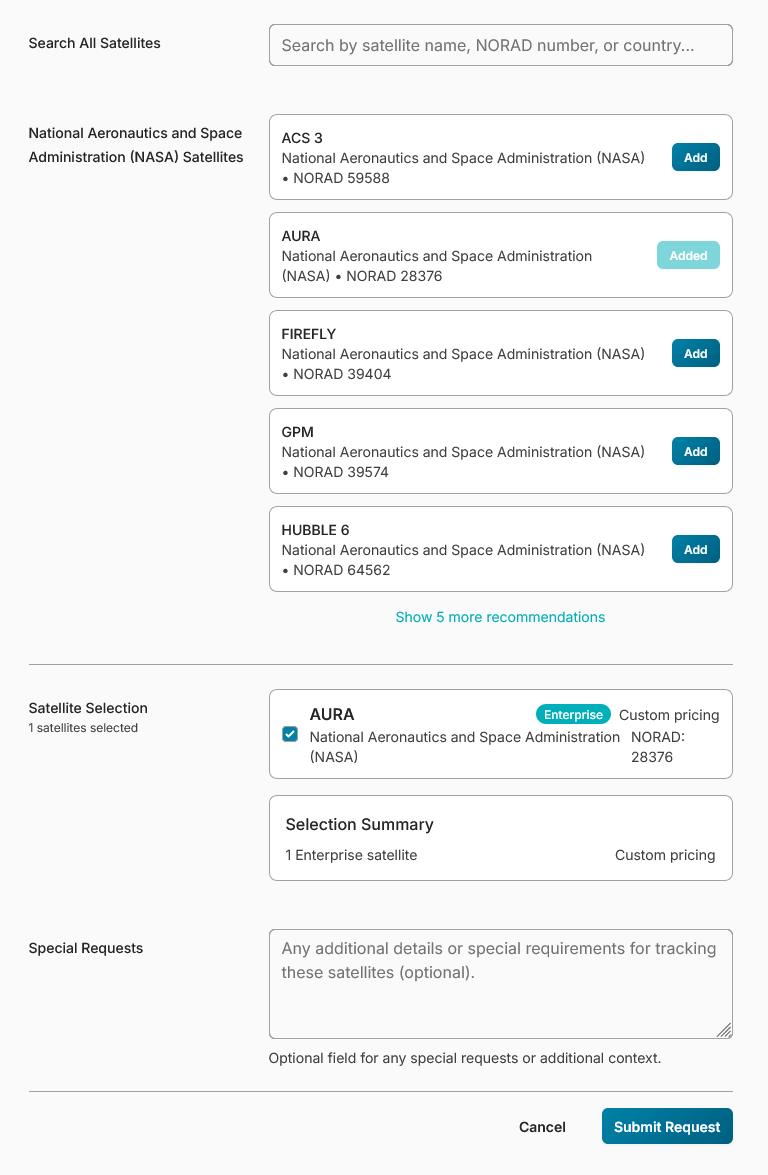
3 Select your organization's satellites that you wish to track
-
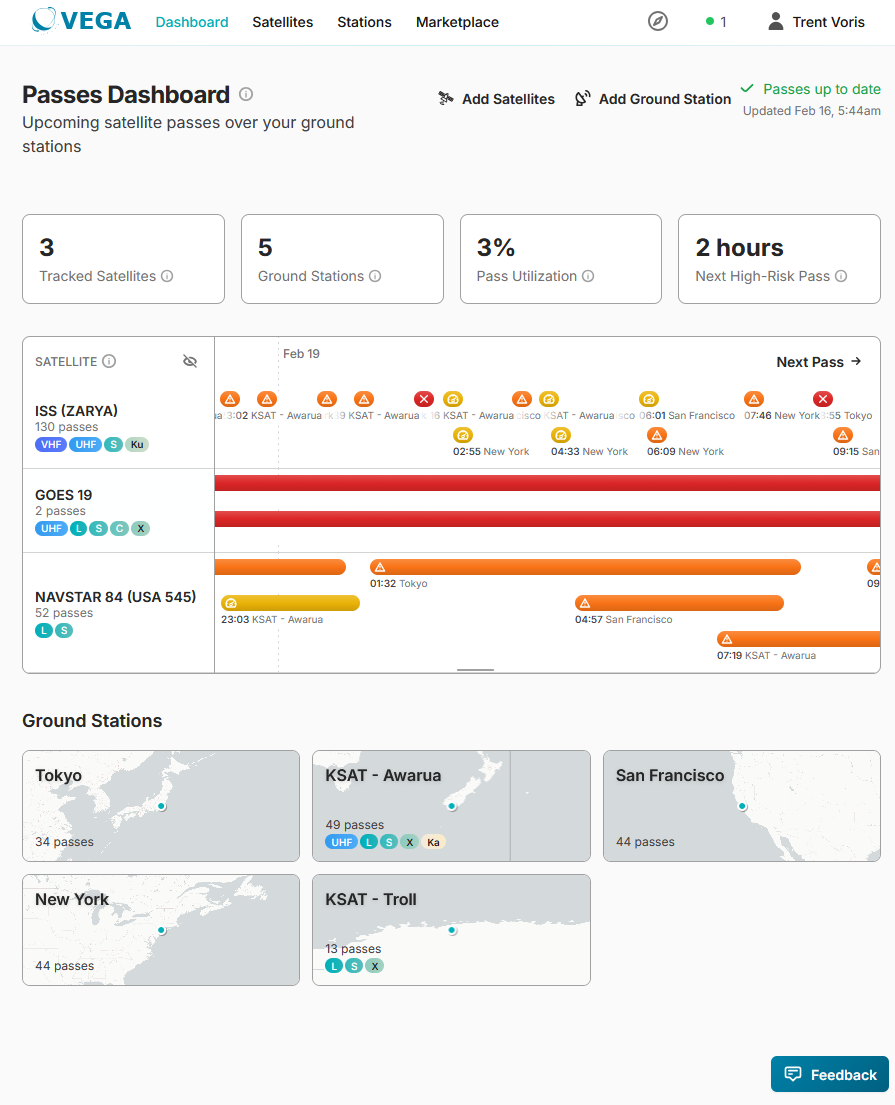
4 Every morning a new forecast runs automatically — passes are evaluated and color-coded based on predefined thresholds
RESTful API
Pull data programmaticallyQuery interference forecasts, satellite metadata, and coverage results via API. Integrate Vega data into your own tools, dashboards, or workflows.
Developers and data teams who need to pull forecast data into their own systems.
Authenticate
Pass your API token as Authorization: Bearer <token>. Enterprise satellite subscription required for all interference endpoints.
Query a single point
GET /api/v1/interference/at_point — returns the count of interfering satellites visible at a given coordinate and time.
curl -H "Authorization: Bearer YOUR_TOKEN" \
  "https://vega.space/api/v1/interference/at_point?\
tracked_satellite_id=ts_abc123&lat=40.7&lon=-74.0&\
timestamp=2025-12-06T08:00:00Z"
Pull time-series data
GET /api/v1/interference/timeseries for interference over time at a location, or
GET /api/v1/interference/ground_station_timeseries for pass-based data over a ground station.
Rate limit: 100 requests/minute. Maximum timeseries window: 7 days (10,080 minutes).
{
  "data": {
    "intensity": 5,
    "timestamp": "2025-12-06T08:05:00Z",
    "nside": 64,
    "cell_resolution_deg": 0.92,
    "frequency_band": "Ka"
  },
  "meta": { "request_id": "...", "timestamp": "..." }
}
intensity is the count of interfering satellites visible at that location and time. Resolution is approximately 100 km (HEALPix nside=64, NESTED ordering).
Go beyond co-visibility forecasting by sharing link-level parameters. Your telemetry calibrates our models — improving accuracy for your satellites and the wider network.
- Beam geometry, antenna patterns
- EIRP, bandwidth, polarization, G/T, modulation
- Measured Eb/N0, noise floor telemetry
- ΔC/I, ΔEb/N0, expected link margin degradation
- Telemetry feedback calibrates our models — improving accuracy and enabling pattern-of-life characterization
Start with the Web App to explore your first forecast, then integrate the API when you're ready to automate. Questions? Get in touch.